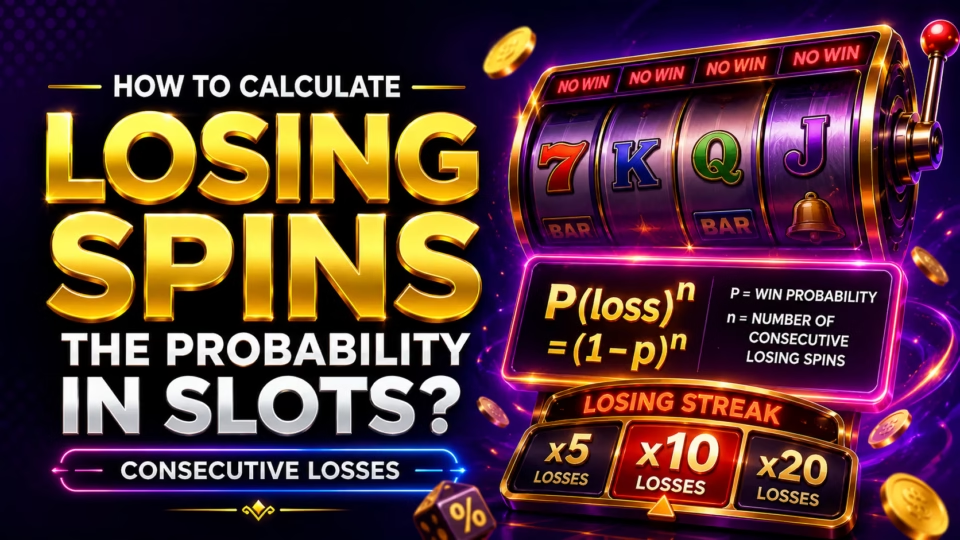
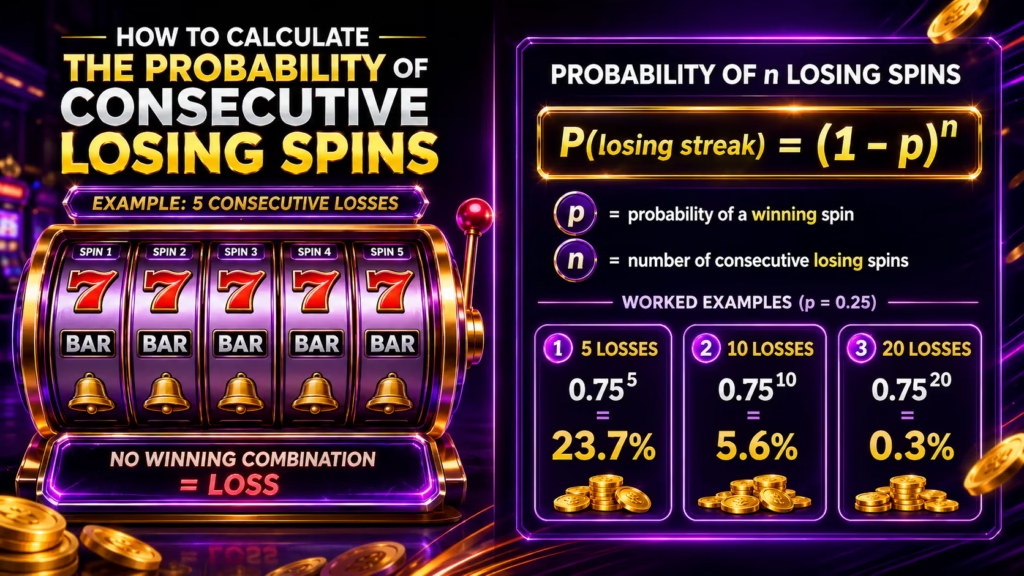
The slot losing streak probability for a specific sequence of spins can be calculated with a simple formula:
P(n consecutive losses) = qⁿ
- P = probability of the losing streak
- q = probability of losing one spin
- n = number of consecutive losing spins
For example, if a slot has a 30% hit frequency and a “loss” means a spin with no payout, the probability of a non-winning spin is 70%, or 0.70. The probability of 10 consecutive non-winning spins starting at a specific point is:
0.70¹⁰ = 0.02825 = 2.82%
This calculation is useful for understanding how normal losing sequences can arise from random play. It does not predict when a winning spin will occur.
Quick Takeaways
- The basic formula for consecutive losses is qⁿ.
- Longer losing streaks become exponentially less likely at a specific starting point.
- A long session creates many opportunities for a streak to occur, so session-level probability is higher than the probability for one fixed sequence.
- RTP cannot be used by itself to calculate losing streak probability.
- Hit frequency and volatility are related to the playing experience, but they are not the same measurement.
- Previous losses do not make a future win “due” when spins are independent.
The calculation is most useful for players trying to understand probability, variance and slot mechanics. It should not be used to decide that a win is about to happen or to justify continuing a losing session.
The Formula for Consecutive Losing Spins
If each spin has the same probability of losing and spins can be treated as independent, the probability of losing several spins consecutively is found by multiplying the single-spin loss probability by itself.
For n losses:
P = q × q × q … = qⁿ
Suppose the probability of losing one spin is 80%.
For 5 consecutive losses:
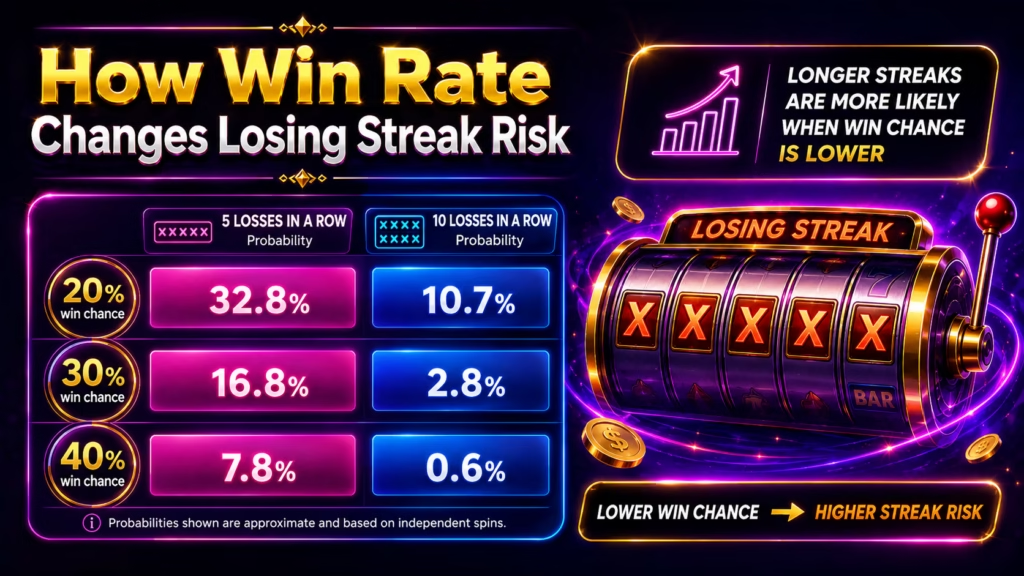
0.80⁵ = 0.32768
The probability is approximately 32.77% for a particular five-spin sequence.
For 10 consecutive losses:
0.80¹⁰ = 0.10737
The probability falls to approximately 10.74%.
For 20 consecutive losses:
0.80²⁰ = 0.01153
That equals approximately 1.15% for a specific block of 20 spins.
The exponential relationship matters. Adding another losing spin does not subtract a fixed percentage from the probability. Instead, the existing probability is multiplied by the loss probability again.
How to Find the Probability of Losing One Spin
The most important input is q, the probability that one spin meets your definition of a loss.
If a game’s hit frequency is known and every hit is being treated as a non-loss:
q = 1 – hit frequency
- For a 30% hit frequency: q = 1 – 0.30 = 0.70
- For a 20% hit frequency: q = 1 – 0.20 = 0.80
- For a 10% hit frequency: q = 1 – 0.10 = 0.90
There is an important limitation. A slot’s published hit frequency usually describes how often a spin produces a qualifying payout according to the game’s definition. A payout can sometimes be smaller than the original stake.
A spin returning $0.50 from a $1 bet may therefore count as a hit while still producing a net loss of $0.50.
Because of this distinction, hit frequency does not automatically equal the probability of having a profitable spin.
Before calculating the probability of consecutive losing spins, define “loss” clearly:
- A spin producing no payout at all.
- A spin returning less than the amount wagered.
- A spin producing no net profit.
These definitions can produce different probabilities.
Examples of Losing Streak Probabilities
The following examples assume that hit frequency can be interpreted as the probability of avoiding a loss and that individual spins have a constant probability.
| Hit Frequency | Loss Probability | 10 Losses | 20 Losses | 30 Losses |
| 30% | 70% | 2.82% | 0.0798% | 0.00225% |
| 20% | 80% | 10.74% | 1.15% | 0.124% |
| 10% | 90% | 34.87% | 12.16% | 4.24% |
These figures apply to a specific sequence beginning at a specific spin.
For example, with a 70% probability of losing each spin, the chance that spins 1 through 10 are all losses is approximately 2.82%.
That does not mean a player has only a 2.82% chance of experiencing 10 losses somewhere during a long session.
Fixed Streak Probability vs Session Probability
The probability of n losses beginning at one specified position is different from the probability of experiencing at least one streak of n losses anywhere within a session.
A 100-spin session contains many possible starting points for a 10-spin losing streak:
- spins 1 to 10
- spins 2 to 11
- spins 3 to 12
- and so on
This creates more opportunities for the streak to appear.
However, simply multiplying qⁿ by the number of possible starting positions does not give an exact probability. Consecutive windows overlap.
For example, a sequence containing 11 consecutive losses also contains two overlapping groups of 10 consecutive losses. Treating those groups as separate independent events would double-count part of the same streak.
Exact Probability of a Losing Streak Somewhere in a Session
An exact calculation can be made using a recurrence model.
Let Aₜ(j) represent the probability that after t spins no streak of r consecutive losses has yet occurred and the current sequence ends with exactly j consecutive losses.
Here: j = 0, 1, 2 … r – 1
Start with:
A₀(0) = 1
After each spin:
Aₜ₊₁(0) = p × ΣAₜ(j)
and:
Aₜ₊₁(j) = q × Aₜ(j – 1)
where:
- p = 1 – q
- q = probability of a loss
- r = target streak length
After N spins:
P(at least one streak of r losses) = 1 – ΣAₙ(j)
This method accounts for overlapping streaks and gives the exact probability under an independent-spin model.
For example, with a 70% loss probability, the probability of encountering at least one run of 10 consecutive losses during 100 spins is about 58.0%.
That is very different from the 2.82% probability that one particular predetermined group of 10 spins will consist entirely of losses.
Why RTP Cannot Calculate Losing Streak Probability
RTP does not tell you the probability of losing an individual spin.
Return to Player represents the theoretical proportion of wagered money that a game is designed to return over its mathematical model or very large number of outcomes. It describes expected value, not the distribution of wins across individual spins.
Two slots can theoretically have similar RTP values while distributing payouts very differently.
One game might produce many small payouts. Another might produce fewer payouts while allocating more of its theoretical return to larger wins.
RTP ≠ hit frequency
RTP alone cannot determine q in the losing streak formula. To calculate the probability of consecutive losing spins accurately, you need the relevant single-spin probability, not just the RTP percentage.
Does Slot Volatility Predict Losing Streaks?
Slot volatility describes the distribution and variability of outcomes, while hit frequency describes how frequently qualifying winning outcomes occur. The two concepts should not be treated as interchangeable.
A high-volatility slot may produce substantial bankroll swings and concentrate more theoretical value in less common outcomes. That does not provide enough information to calculate its exact probability of 10, 20 or 30 consecutive losing spins.
Similarly, a low-volatility slot does not guarantee frequent profitable spins.
For mathematical streak calculations, use an actual hit probability or another appropriate probability derived from the game’s rules.
What If the Hit Frequency Is Unknown?
If official hit-frequency information is unavailable, the probability can only be estimated from observed results.
Suppose 10,000 recorded spins contain 2,500 qualifying hits.
2,500 ÷ 10,000 = 0.25
The estimated hit probability would be 0.25. The estimated non-hit probability would therefore be:
q = 1 – 0.25 = 0.75
The estimated probability of 10 consecutive non-hit spins starting at a particular position would be:
0.75¹⁰ ≈ 5.63%
An observed sample is only an estimate of the underlying probability. Small samples can differ considerably from the game’s long-run mathematical characteristics.
If an official game specification or paytable provides relevant probability information, that is preferable to estimating the value from a short playing session.
Why Losing Streaks Can Feel More Unusual Than They Are
Human intuition tends to underestimate how frequently streaks appear in repeated random trials.
Consider a slot where the probability of a non-winning spin is 90%.
- Ten consecutive non-winning spins: 0.90¹⁰ ≈ 34.87%
- Twenty consecutive non-winning spins: 0.90²⁰ ≈ 12.16%
- Thirty consecutive non-winning spins: 0.90³⁰ ≈ 4.24%
These probabilities refer to fixed sequences. Across a sufficiently long session, there are multiple opportunities for such runs to appear.
A long losing sequence therefore does not automatically demonstrate that a game’s RNG has changed or that something unusual has happened.
Does a Losing Streak Make the Next Win More Likely?
If spins are independent and the game state has not changed, previous losses do not increase the probability of winning the next spin.
Suppose a slot has a 20% probability of a qualifying hit. After one loss, five consecutive losses, ten consecutive losses or twenty consecutive losses, the next independent spin still has the same 20% hit probability.
The belief that a win becomes increasingly “due” after repeated losses is known as the gambler’s fallacy.
A streak can look statistically dramatic without creating predictive information about the next independent outcome.
Expected Waiting Time Is Not a Prediction
Probability theory can also estimate the average waiting time before a particular losing run appears.
For independent spins with loss probability q, the expected number of spins until the first run of r consecutive losses is:
E = (1 – qʳ) ÷ [(1 – q) × qʳ]
For a 70% loss probability and a target of 10 consecutive losses:
E ≈ 115 spins
This does not mean a 10-loss streak will occur every 115 spins. It is a mathematical expectation across many hypothetical sequences.
One session could produce the streak almost immediately. Another could continue for hundreds of spins without one.
Common Mistakes When Calculating Losing Streaks
Using RTP as the win probability. A 96% RTP does not mean that 96% of spins win. RTP measures theoretical monetary return, not winning-spin frequency.
Treating every payout as a profitable spin. A payout smaller than the stake can still represent a net loss. Check how “hit” and “win” are defined before using hit frequency.
Multiplying the streak probability by the number of session windows. Overlapping sequences are not independent. Simple multiplication can produce a badly distorted estimate.
Assuming a streak changes the next spin. An independent RNG does not compensate for previous losses simply because a streak has become long.
Using a small personal sample as the game’s true probability. A few hundred spins may give a very unstable estimate of hit frequency. Short-term results can differ substantially from long-run probabilities.
How to Use Losing Streak Probability in Practice
Losing streak calculations are best used for understanding risk rather than predicting outcomes.
They can help illustrate:
- why long dry periods can occur naturally;
- how hit frequency changes the likelihood of consecutive non-winning spins;
- why session length matters;
- why a streak does not make a future win inevitable;
- why bankroll limits should be decided before play begins.
Probability should not be used as a reason to continue gambling after reaching a spending or time limit.
A streak that seems unlikely can still occur, and mathematics cannot determine when the next winning outcome will arrive.
How This Information Was Reviewed
The calculations in this guide use the standard probability model for repeated independent events with a constant single-spin loss probability.
The most important limitation is the definition of a losing spin. Published hit frequency may count any qualifying payout, including outcomes that return less than the original wager. Exact game rules, paytables and probability information should therefore be checked when available.
RTP, volatility and recent results cannot guarantee or predict the outcome of the next spin. Slot play should be treated as paid entertainment, not as a method of earning money. Setting spending and time limits before playing is more useful than trying to recover losses based on streak probability.
FAQ
What is the probability of 10 consecutive losing spins?
The probability is q¹⁰, where q is the probability of losing one spin. If the loss probability is 70%, the probability of 10 consecutive losses beginning at a specified spin is approximately 2.82%.
What is the probability of 20 consecutive losing spins?
The probability is q²⁰. With an 80% single-spin loss probability, 20 consecutive losses have a probability of approximately 1.15% for a predetermined 20-spin sequence.
How do you calculate slot losing streak probability?
Convert the single-spin loss probability into decimal form and raise it to the number of consecutive losses. For a 75% loss probability and 12 losses, calculate 0.75¹², which is approximately 3.17%.
Can RTP be used to calculate consecutive losses?
No. RTP measures theoretical monetary return and does not reveal how frequently individual spins produce wins. You need hit frequency or another appropriate single-spin probability to calculate consecutive losing spins.
Does losing 10 times make the next spin more likely to win?
No, not when spins are independent and the underlying probabilities remain unchanged. A previous sequence of losses does not make a winning outcome mathematically due on the next independent spin.
Is a long losing streak evidence that a slot is rigged?
Not by itself. Long sequences can occur naturally in random processes, especially when the probability of losing an individual spin is already high. A streak alone is not enough to determine whether a game’s operation is abnormal.
Is hit frequency the same as the chance of making a profit on a spin?
Not necessarily. Hit frequency may include payouts smaller than the amount wagered. A spin can therefore count as a hit while still producing a net monetary loss.
Are losing streaks more common in high-volatility slots?
Not necessarily. Volatility measures variability in payout distribution, while losing streak probability depends directly on the probability used to define a losing spin. Exact hit frequency is needed for a direct streak calculation.
How does session length affect the chance of a losing streak?
Longer sessions provide more possible starting points for a streak, so the probability of experiencing at least one target streak generally increases with the number of spins. Exact session-level calculations must account for overlapping sequences.
Can losing streak probability predict when the next win will happen?
No. Losing streak probability describes how likely sequences are under a mathematical model. It cannot identify which future spin will win, and previous losses do not predict the next independent RNG outcome.
Short Conclusion
The probability of n consecutive losing spins starting at a specific point is calculated as qⁿ, where q is the probability of losing one spin. The calculation becomes more complex when asking whether a losing streak will occur anywhere during a longer session because possible streaks overlap.
RTP alone cannot provide the required loss probability, and hit frequency must be interpreted carefully because a hit is not always a profitable spin. Losing streak mathematics is useful for understanding randomness and risk, but it cannot predict the next win or make a winning outcome “due.”