
Mines game probability depends mainly on three numbers: the total number of tiles, the number of mines hidden on the board, and how many safe tiles you want to reveal before cashing out. More mines increase the chance of hitting a mine, while every additional safe pick reduces the probability of surviving the entire sequence.
For a board with 25 tiles, choosing 1 mine gives a 96% chance that the first pick is safe. With 5 mines, the first-pick safe probability falls to 80%. With 10 mines, it drops to 60%.
The important point is that Mines game odds change after every successful pick. A player who has already revealed several safe tiles has fewer unknown tiles remaining, so the probability of the next pick can be calculated from the remaining safe tiles and remaining total tiles.
Quick takeaways:
- More mines mean lower survival probability and usually higher available multipliers.
- More safe picks mean a lower probability of completing the entire sequence.
- Choosing a particular tile normally does not improve the mathematical odds when mines are distributed randomly.
- Cashing out earlier reduces exposure to additional mine risk but does not remove the house edge built into the game.
- Mines should be treated as entertainment, not as a reliable way to make money.
Mines probability calculations are especially useful for players who want to understand how quickly risk increases when they add mines or continue revealing tiles.
How Mines Game Probability Works
Mines is usually based on a grid containing safe tiles and hidden mines. Before the round starts, the player selects how many mines will be placed on the board. The objective is to reveal safe tiles without selecting a mine.
If a board contains N total tiles, M mines, and N – M safe tiles, then the probability that the first selected tile is safe is:
P(safe first pick) = (N – M) / N
For example, on a 25-tile board with 5 mines:
20 / 25 = 0.80
The probability of the first pick being safe is therefore 80%.
The probability of hitting a mine on that first pick is 5 / 25 = 20%.
These probabilities describe only the next selection. Surviving several consecutive picks requires a different calculation because safe tiles are removed from the available pool after they are revealed.
Mines Game Probability Formula for Multiple Safe Picks
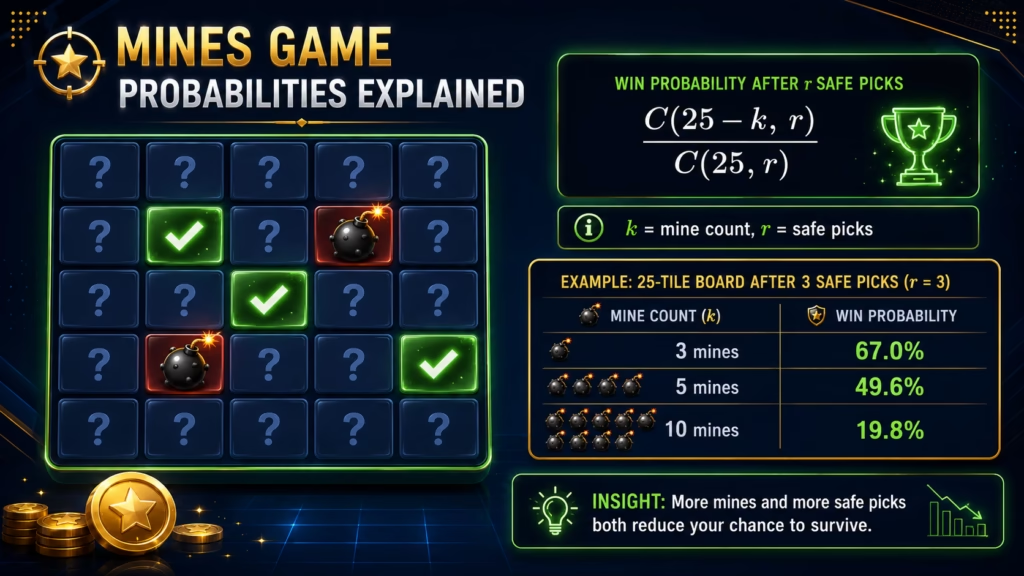
The probability of successfully revealing several safe tiles without hitting a mine can be calculated using combinations:
P(S safe picks) = C(N – M, S) / C(N, S)
where N is the total number of tiles, M is the number of mines, S is the number of safe picks, and C is the number of possible combinations.
The same probability can be written as a sequence:
P(S safe picks) = (N – M)/N × (N – M – 1)/(N – 1) × …
This formula shows why the risk accumulates. Even when each individual selection appears relatively safe, surviving many consecutive selections becomes increasingly unlikely.
For example, consider a 25-tile board with 5 mines. The probability of surviving the first pick is 20 / 25 = 80%. The probability of surviving two consecutive picks is 20/25 × 19/24 ≈ 63.33%. The probability of surviving five consecutive safe picks is approximately 29.18%.
This distinction is important. An 80% chance of surviving the next pick does not mean there is an 80% chance of surviving several picks.
Mines Game Odds by Mine Count
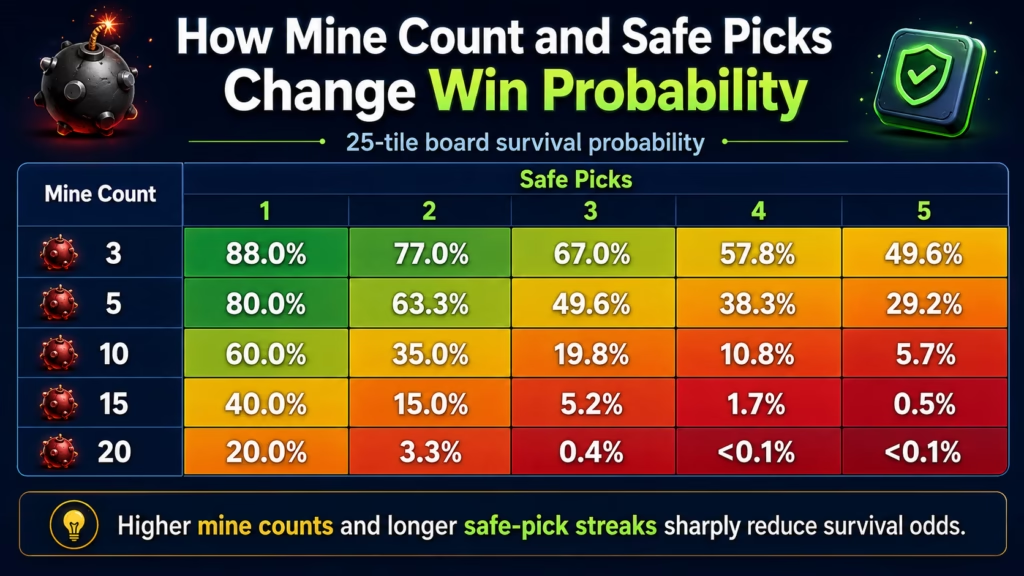
The following example uses a 25-tile board to show how mine count changes the probability of completing different numbers of safe picks.
| Mines | 1 Safe Pick | 3 Safe Picks | 5 Safe Picks | 10 Safe Picks |
| 1 | 96.00% | 88.00% | 80.00% | 60.00% |
| 3 | 88.00% | 66.96% | 49.57% | 19.78% |
| 5 | 80.00% | 49.57% | 29.18% | 5.65% |
| 10 | 60.00% | 19.78% | 5.65% | 0.09% |
| 20 | 20.00% | 0.43% | 0.002% | Impossible |
The table demonstrates how sharply Mines game probability can decline when both mine count and safe-pick count increase.
With 1 mine, surviving five picks on a 25-tile board has an 80% probability. With 10 mines, surviving the same five picks has only about a 5.65% probability.
Higher mine counts therefore change the risk profile dramatically.
How Mine Count Changes the Risk
Increasing the number of mines reduces the proportion of safe tiles before the first selection is made.
On a 25-tile board:
- 1 mine leaves 24 safe tiles, giving a 96% first-pick safe probability.
- 3 mines leave 22 safe tiles, giving an 88% first-pick safe probability.
- 5 mines leave 20 safe tiles, giving an 80% first-pick safe probability.
- 10 mines leave 15 safe tiles, giving a 60% first-pick safe probability.
- 20 mines leave only 5 safe tiles, giving a 20% first-pick safe probability.
Games generally compensate for greater risk with larger potential multipliers. However, a larger multiplier does not mean the player has found better odds. It normally reflects the lower probability of successfully reaching that point, with the game’s mathematical advantage potentially incorporated into the payout structure.
Exact multipliers and house edge should be checked in the specific game rules because they can differ between operators and implementations.
How Safe Picks Change the Probability
Every additional safe pick adds another condition that must be satisfied for the player to reach a particular multiplier.
Consider 3 mines on a 25-tile board. The first pick has an 88% probability of being safe. Surviving three selections has a probability of approximately 66.96%. Surviving five drops to approximately 49.57%. Reaching ten safe picks without touching a mine has a probability of only about 19.78%.
This is cumulative probability.
Players sometimes focus only on the chance of surviving the next selection. That can make a long sequence appear safer than it really is. The relevant number when comparing cash-out targets is the probability of reaching the target from the beginning of the round.
What Is the Probability of the Next Safe Pick?
After successful picks have already been revealed, the probability of the next selection being safe changes.
If a player has successfully revealed K safe tiles, the next-pick probability is:
P(next safe pick) = (N – M – K) / (N – K)
For example, suppose a 25-tile board contains 5 mines and the player has already found 3 safe tiles. There are now 22 unrevealed tiles, 17 safe tiles, and 5 mines.
The probability that the next selected tile is safe is 17 / 22 ≈ 77.27%. The probability that the next tile contains a mine is 5 / 22 ≈ 22.73%.
The next-pick risk therefore becomes greater as safe tiles are removed while all mines remain unrevealed.
Does Choosing Certain Tiles Improve Mines Game Odds?
If mines are placed uniformly at random and no additional information is revealed, every unrevealed tile has the same probability of containing a mine.
Choosing corners, the center, diagonal patterns, alternating tiles, or previously successful positions does not mathematically improve the probability under those conditions.
A pattern may make selections easier to remember, but it does not change the underlying combination of safe tiles and mines.
This also means that previous rounds do not identify which positions will be safe in a future independent round. A tile that contained a mine several times previously is not automatically more or less likely to contain one in the next round.
Players should check the specific game’s rules and fairness information because implementation details depend on the operator.
Low Mine Count vs High Mine Count
A low mine count produces a higher probability of surviving individual selections, while a high mine count creates a much steeper risk curve.
Low mine count
A configuration with one or a few mines may appeal to players who prefer:
- higher probabilities of reaching several safe picks;
- smaller changes in risk between early selections;
- generally lower multipliers for equivalent pick counts.
Low mine count does not eliminate gambling risk. Continuing for enough selections can still reduce the cumulative survival probability substantially.
High mine count
A configuration with many mines may appeal to players who accept:
- a greater probability of losing the round quickly;
- lower chances of completing multiple selections;
- potentially much larger multipliers associated with rare successful sequences.
High-mine configurations should not be interpreted as shortcuts to profit. Higher potential payouts exist because successful outcomes are less probable.
Cashing Out Early vs Making More Picks
Cashing out earlier normally means accepting a smaller multiplier after exposing the round to fewer additional mine selections.
Continuing to pick can increase the available payout multiplier, but it also reduces the probability of reaching that multiplier.
For example, with 5 mines on a 25-tile board:
- reaching 1 safe pick has an 80% probability;
- reaching 3 safe picks has about a 49.57% probability;
- reaching 5 safe picks has about a 29.18% probability;
- reaching 10 safe picks has about a 5.65% probability.
There is no cash-out point that guarantees a profitable result over repeated play. The operator’s payout table can include a house edge, so probability alone should not be confused with expected profit.
Mines Probability vs Multiplier
Probability and multiplier are closely related but they are not the same measurement.
Probability describes how likely a particular sequence is to occur.
Multiplier describes how much the game pays if the player successfully reaches a particular stage and cashes out.
A fair mathematical multiplier before accounting for a house edge would be related to the inverse of the probability:
Fair multiplier ≈ 1 / probability
For example, an outcome with a theoretical probability of 25% would correspond to a fair multiplier of approximately 4.00x before any house advantage or other payout adjustment.
Actual Mines multipliers may be lower than the pure fair-odds multiplier because the operator can incorporate a house edge. Players should use the displayed paytable or game rules rather than assuming a multiplier from probability alone.
Common Mines Probability Mistakes
Treating each pick as an independent event
Selections within the same Mines round are not independent because revealing a safe tile removes one safe tile from the board.
Looking only at the next-pick probability
A relatively high probability for the next tile can hide a much lower probability of completing a long sequence.
Believing tile patterns change the odds
When all unrevealed positions are equally likely to contain mines, geometric patterns do not create a mathematical advantage.
Assuming a losing streak makes a safe result more likely
Previous independent rounds do not normally make the next round ‘due’ for a win. This is a form of gambler’s fallacy.
Comparing multipliers without comparing probability
A very large multiplier usually corresponds to a much less probable successful sequence. Potential payout should always be considered together with the probability required to reach it.
How to Compare Mines Configurations
The most useful way to compare Mines configurations is to evaluate both mine count and target number of safe picks.
A practical comparison process is:
1. Check the total number of tiles.
2. Check the selected number of mines.
3. Calculate or review the probability of reaching the intended number of safe picks.
4. Compare that probability with the displayed cash-out multiplier.
5. Check the game’s published rules, RTP or house edge information when available.
6. Set a spending limit before playing rather than increasing risk after losses.
This approach does not predict the result of a round. It simply shows the mathematical risk attached to different configurations.
How This Information Was Reviewed
The probability calculations in this guide are based on standard combinations without replacement, assuming a fixed board size and uniformly distributed mines.
The 25-tile examples are illustrations rather than universal settings. Players should check the actual board size, mine count, multiplier table, RTP or house edge information, and game rules for the specific Mines implementation they use.
Probability describes long-run mathematical likelihood, not the result of an individual round. A high-probability selection can still lose, and a very low-probability sequence can still occur.
Mines is a gambling game and should be treated as entertainment rather than a source of income. Players should set financial and time limits before playing and stop when gambling is no longer recreational.
FAQ
What is the Mines game probability formula?
For a board with N total tiles, M mines and S intended safe picks, the probability of completing all safe picks is C(N – M, S) / C(N, S). This calculates the proportion of possible S-tile combinations that contain no mines.
What are the odds of hitting a mine on the first pick?
The probability of hitting a mine on the first pick is M / N, where M is the number of mines and N is the number of tiles. On a 25-tile board with 5 mines, the first-pick mine probability is 5/25, or 20%.
What are the odds of a safe first pick in Mines?
The probability of a safe first pick is (N – M) / N. On a 25-tile board with 3 mines, 22 tiles are safe, giving a first-pick safe probability of 88%.
Do Mines odds get worse after every safe pick?
The probability of the next pick being safe generally decreases after each successful selection if all mines remain hidden. For example, with 5 mines on a 25-tile board, the first safe-pick probability is 80%. After three safe tiles have been revealed, the next-pick probability is about 77.27%.
Is it better to play with fewer mines?
Fewer mines provide a higher probability of surviving each selection, but they usually correspond to lower multipliers. More mines increase both risk and potential payout. Neither configuration removes the house edge or guarantees a profitable result.
Is there a best tile to choose in Mines?
There is no mathematically superior tile if mines are distributed uniformly at random and every unrevealed tile has the same probability. Corners, center tiles and patterns therefore have identical odds under those assumptions.
Can Mines patterns predict where mines will appear?
Selection patterns cannot predict mine locations in a properly randomized game. A pattern can organize how a player selects tiles, but it does not change the mathematical probability of the hidden positions.
Does cashing out early improve the odds?
Cashing out after fewer successful picks reduces the number of additional mine selections required, so the probability of reaching an early target is higher than reaching a later one. It does not create guaranteed profit because payouts can include a house edge.
Can Mines probability be used to guarantee a win?
No. Probability can quantify risk but cannot determine which individual tile will contain a mine. Even an outcome with a very high probability can fail in a single round, and no probability calculation guarantees a winning session.
Brief Conclusion
Mines game probability is determined by board size, mine count and the number of safe picks required. More mines and more picks both reduce the probability of completing a round successfully.
On a 25-tile board, for example, five mines give an 80% chance of surviving one pick but only about a 29.18% chance of surviving five consecutive picks. The key is to distinguish the probability of the next safe tile from the cumulative probability of reaching a target cash-out point.
Probability calculations can explain Mines game odds, but they cannot predict mine locations or remove the house edge. Treat Mines as entertainment, use predefined limits and never assume that a pattern or previous result guarantees the next outcome.