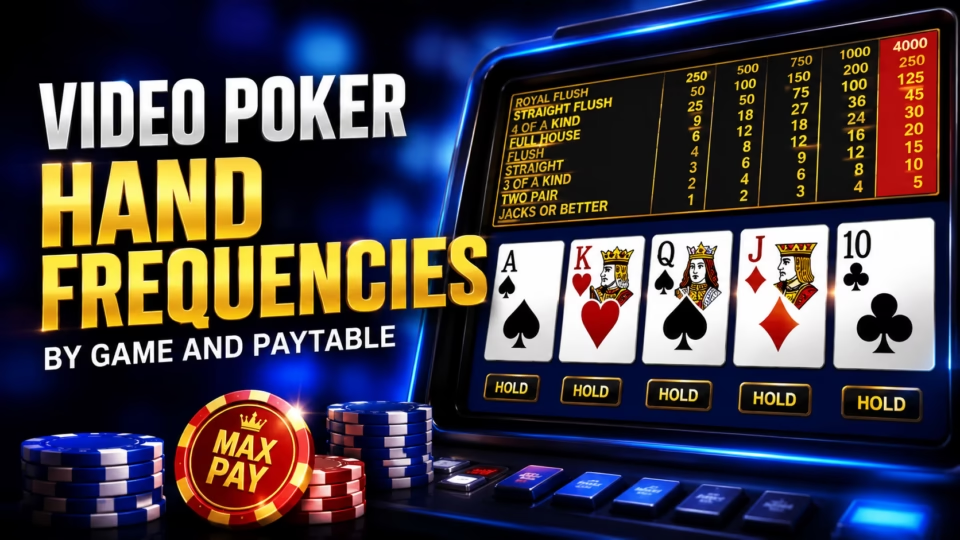
Video poker hand frequency is the long-run probability of finishing a hand with a particular result, such as a pair of Jacks or Better, two pair, a straight, four of a kind, or a royal flush. The frequency is not determined by the 52-card deck alone. It also depends on the video poker variant, the paytable, and the strategy used to decide which cards to hold and discard.
For example, under optimal strategy, 9/6 Jacks or Better finishes with a royal flush about 0.002476% of the time, while a paying pair of Jacks or Better appears about 21.46% of the time. The same game with a different paytable can produce slightly different final-hand frequencies because the mathematically correct hold decisions can change.
Quick takeaways
- Hand frequency describes how often a final hand occurs, not how much that hand pays.
- The game variant usually changes frequencies more than a small paytable adjustment.
- A paytable can still alter frequencies because different payouts can change optimal strategy.
- Royal flushes are extremely rare in standard video poker, commonly occurring roughly once per 40,000 final hands in games such as Jacks or Better.
- A higher overall hit frequency does not automatically mean a better return or lower house edge.
- Short sessions can differ dramatically from theoretical frequencies because the figures describe long-run mathematical averages.
What Is Video Poker Hand Frequency?
Video poker hand frequency measures how often a particular final hand is expected to occur when a defined strategy is used. If a hand has a probability of 0.01, its theoretical frequency is 1%, or about once every 100 completed hands over a sufficiently large sample.
The important word is final. Video poker gives the player an initial five-card deal, followed by a decision about which cards to hold. Replacement cards are then drawn. Hand-frequency tables normally describe the hand after that draw, not the probability of receiving the combination on the initial deal.
Strategy therefore matters. Two players receiving the same starting cards can choose different holds and create different distributions of final results. Mathematical video poker analyses usually assume optimal strategy for the exact paytable being studied.
9/6 Jacks or Better Hand Frequencies
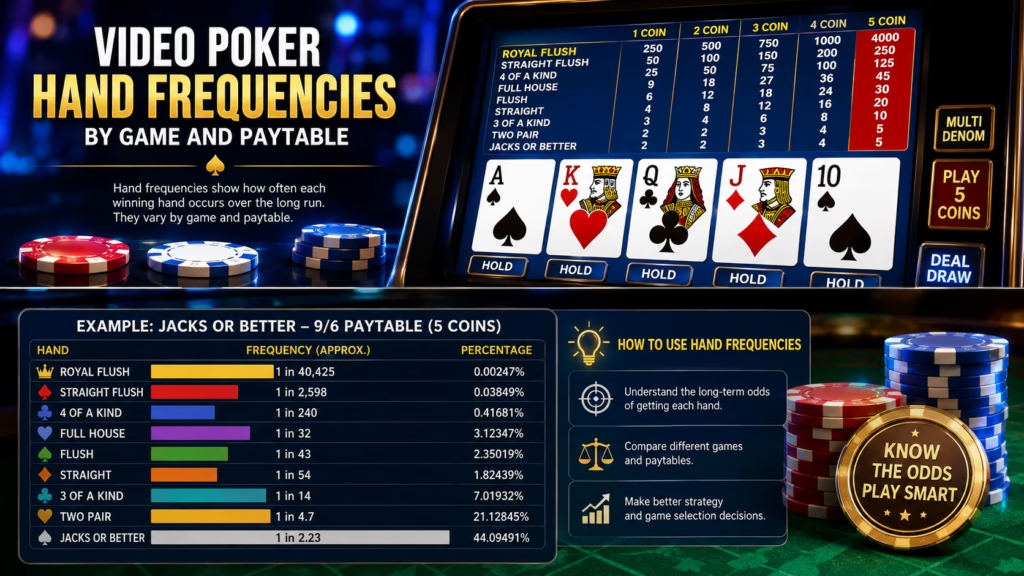
9/6 Jacks or Better is a useful baseline because its hand structure is straightforward. The name 9/6 refers to a full house paying 9 units per unit wagered and a flush paying 6 when the standard maximum-coin paytable is expressed on a one-unit basis.
With optimal play, the theoretical frequencies are:
| Final hand | Probability | Approximate frequency |
| Royal flush | 0.002476% | 1 in 40,391 |
| Straight flush | 0.010931% | 1 in 9,148 |
| Four of a kind | 0.236255% | 1 in 423 |
| Full house | 1.151221% | 1 in 87 |
| Flush | 1.101451% | 1 in 91 |
| Straight | 1.122937% | 1 in 89 |
| Three of a kind | 7.444870% | 1 in 13.4 |
| Two pair | 12.927890% | 1 in 7.7 |
| Jacks or Better | 21.458503% | 1 in 4.7 |
| Nothing | 54.543467% | About 1 in 1.8 |
A paying result therefore occurs on roughly 45.46% of completed 9/6 Jacks or Better hands under optimal strategy. This figure includes hands that merely return the original wager, such as one pair of Jacks or Better, so it should not be interpreted as a 45% chance of making a net profit on every hand.
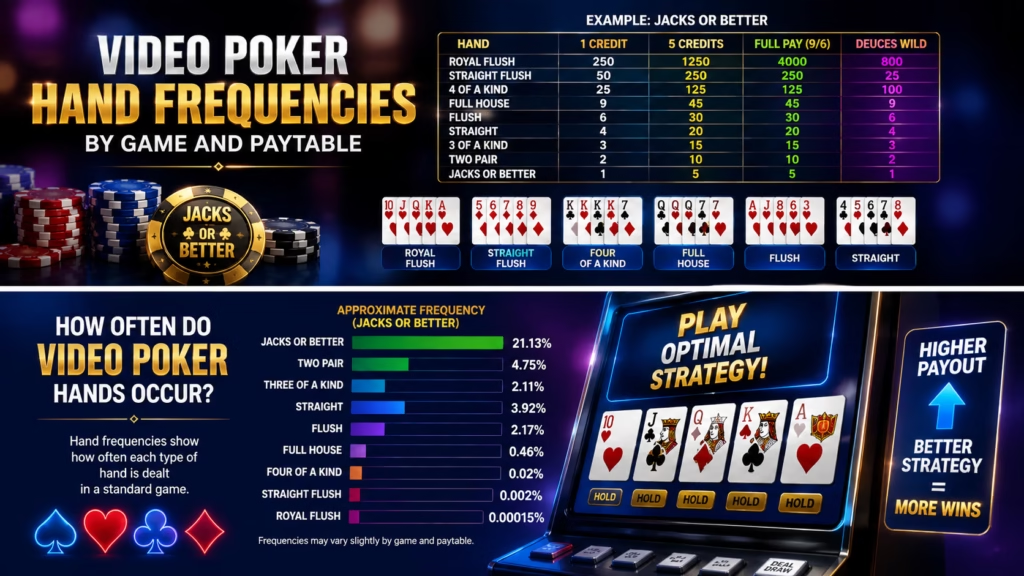
The most common paying result is a high pair. Large hands are much rarer. Four of a kind occurs around once per 423 hands, while a royal flush is approximately a once-in-40,000-hand event under the theoretical optimal-play distribution.
How Paytables Change Hand Frequency
A paytable does more than change the amount won for a particular hand. It can change which hold has the highest expected value, which in turn changes the distribution of final hands.
The effect can be small when two paytables are similar. In 9/6 Jacks or Better, the probability of finishing with Jacks or Better is approximately 21.4585%. In 8/5 Jacks or Better, where the full house and flush payouts are reduced, the corresponding probability is approximately 21.5071%. The overall losing-hand frequency also shifts slightly from about 54.5435% in 9/6 to 54.5022% in 8/5.
A game can produce slightly more frequent paying hands while having a worse theoretical return.
The theoretical optimal-play return for 9/6 Jacks or Better is about 99.54%, compared with about 97.30% for the listed 8/5 version. The lower-paying paytable is therefore not improved simply because some small-hand frequencies are marginally higher.
Video Poker Hand Frequencies by Game
Different video poker families can produce noticeably different final-hand distributions because they reward different combinations and encourage different hold decisions.
| Game and paytable | Losing-hand frequency | Approx. frequency of any paying result |
| 9/6 Jacks or Better | 54.54% | 45.46% |
| 8/5 Bonus Poker | 54.49% | 45.51% |
| 9/6 Double Double Bonus | 55.28% | 44.72% |
| Full-Pay Deuces Wild | 54.69% | 45.31% |
These figures assume the optimal strategy associated with each listed paytable. The differences look modest when only total paying-hand frequency is considered, but the distribution inside those winning hands can be very different.
8/5 Bonus Poker
8/5 Bonus Poker gives enhanced payouts for selected four-of-a-kind hands. Under optimal strategy, four aces occur about 0.0196% of hands, four 2s through 4s about 0.0527%, and four 5s through Kings about 0.1640%. Combined, four-of-a-kind results remain relatively uncommon, but the paytable places more value on their rank than standard Jacks or Better does.
The same 8/5 Bonus Poker table produces Jacks or Better approximately 21.53% of the time, two pair around 12.93%, and three of a kind around 7.45%. The theoretical optimal return for this paytable is about 99.17%.
9/6 Double Double Bonus Poker
Double Double Bonus Poker places much more value on certain four-of-a-kind combinations, particularly aces and low quads with qualifying kickers. Its strategy therefore differs from ordinary Jacks or Better.
For the 9/6 Double Double Bonus paytable, a pair of Jacks or Better occurs about 21.13% of completed hands, two pair about 12.31%, and three of a kind about 7.53%. Losing hands account for approximately 55.28%, giving an overall paying-hand frequency of about 44.72%.
This illustrates why hit frequency alone is incomplete. Double Double Bonus can generate fewer paying outcomes than Jacks or Better while placing substantially more value on particular rare hands.
Full-Pay Deuces Wild
Deuces Wild changes the hand-frequency structure much more dramatically because every 2 acts as a wild card. The minimum standard paying hand is also different from Jacks or Better.
Under the full-pay Deuces Wild paytable, three of a kind appears approximately 28.47% of the time, four of a kind about 6.49%, a straight about 5.61%, and a full house about 2.12%. A natural royal flush occurs only about 0.0022% of hands.
The high frequency of three and four of a kind does not mean Deuces Wild simply produces stronger natural poker hands. Wild cards make those combinations easier to complete, so direct comparisons with non-wild games need to account for the different rules.
Hand Frequency vs Hit Frequency
Hand frequency normally refers to the probability of a specific final combination. Hit frequency usually refers to how often any qualifying payout occurs.
For example, 9/6 Jacks or Better has individual frequencies for a royal flush, straight flush, quads, full house and every other final category. Adding all paying categories produces an overall hit frequency of roughly 45.46%.
Hit frequency still does not tell you how often a hand creates a net gain. A one-unit payout on a one-unit wager is normally a push, not a profit. Players comparing games should therefore separate:
- probability of any payout;
- probability of a net-winning result;
- average value of the payout;
- theoretical return;
- volatility.
Those measurements describe different aspects of the game.
Does a Royal Flush Really Occur Once Every 40,000 Hands?
A royal flush in conventional Jacks or Better is commonly quoted at roughly once every 40,000 completed hands, and the optimal-play probability for 9/6 Jacks or Better is about 0.00002476, equivalent to approximately one royal per 40,391 hands.
That does not create a countdown. Playing 39,000 hands without a royal does not make a royal guaranteed or due. Each new deal and draw is still governed by the game’s random card selection process. Long-run frequency describes a probability distribution across many hands, not a schedule for individual wins.
Why Your Actual Results Will Not Match the Table Exactly
Theoretical hand frequencies are long-run averages, so a session of several hundred or even several thousand hands can differ substantially from the calculated distribution.
Rare outcomes are especially uneven. A player can go far beyond the theoretical royal-flush interval without seeing one, while another player can receive multiple royals in a much shorter sample. Neither observation changes the underlying mathematical probability.
Strategy errors also change actual frequencies. If a player repeatedly keeps a made hand when the mathematically preferred hold for the exact paytable is different, the player’s long-run hand distribution and return will differ from an optimal-strategy calculation.
How to Compare Video Poker Paytables Correctly
Do not choose a video poker game solely by looking for the highest hit frequency. A useful comparison should include the entire paytable and the strategy associated with it.
Check:
- payout for a royal flush at the wager level you intend to use;
- full-house and flush payouts;
- payouts for different four-of-a-kind categories;
- whether deuces, jokers, or other cards are wild;
- minimum qualifying winning hand;
- theoretical return under optimal strategy;
- strategy complexity;
- volatility and concentration of return in rare hands.
Two machines carrying the same game name may use different paytables. Bonus Poker, for example, can be offered with 8/5, 7/5, 6/5 and other configurations, and the optimal returns and hand probabilities vary between them.
Common Misconceptions About Video Poker Hand Frequency
A higher hit frequency means a better game
Not necessarily. Frequent low-value payouts can produce a higher hit rate without producing a higher theoretical return.
A lower-paying paytable only changes the casino edge
Not always. The changed payout can also change the mathematically correct hold decision, which alters some final-hand frequencies.
A royal becomes more likely after a long dry spell
No. Long-term frequency does not make a rare hand overdue. Previous hands do not create a guaranteed future royal.
The same strategy works for every video poker game
No. Jacks or Better, Bonus Poker, Double Double Bonus and Deuces Wild assign different values to draws and made hands. Strategy should match the exact variant and paytable.
How This Information Was Reviewed
The frequencies in this guide are based on mathematical probability tables for specific video poker variants and paytables under optimal strategy. Jacks or Better, Bonus Poker, Double Double Bonus and Deuces Wild are treated as separate mathematical systems rather than as interchangeable versions of the same game.
Before playing a real-money version, check the exact in-game paytable because a casino or software implementation may offer a different configuration. Theoretical return and hand frequency describe long-run mathematics and do not predict the outcome of a particular session.
Video poker should be treated as entertainment rather than a way to generate income. Set spending and time limits before playing, and do not increase wagers in an attempt to recover losses or force a rare hand to appear.
FAQ
What is the hand frequency in video poker?
Video poker hand frequency is the probability that a specific combination will appear as the final hand after the draw. The percentage depends on the game, paytable and strategy used.
What is the most common winning hand in Jacks or Better?
A pair of Jacks, Queens, Kings or Aces is the most common paying result in standard 9/6 Jacks or Better. Under optimal strategy, Jacks or Better appears in approximately 21.46% of completed hands.
How often do you get four of a kind in video poker?
In 9/6 Jacks or Better, four of a kind occurs about 0.236% of the time, or approximately once every 423 completed hands under optimal strategy. Other variants can have different frequencies because their strategies and wild-card rules differ.
How often does a royal flush occur in video poker?
In 9/6 Jacks or Better, the optimal-play royal flush probability is approximately 0.002476%, which corresponds to roughly once per 40,391 hands in the long run. This is an average frequency, not a guarantee that a royal will appear within any 40,391-hand period.
Does the paytable affect video poker hand frequency?
Yes. A different paytable can change which cards should be held under optimal strategy, which can slightly alter the probability of particular final hands. The effect is often modest between closely related paytables but can still be mathematically measurable.
Which video poker game has the highest hit frequency?
There is no universal answer because hit frequency depends on the exact game and paytable. Among the examples compared here, 8/5 Bonus Poker produces a paying result on about 45.51% of optimal-play hands, compared with about 45.46% for 9/6 Jacks or Better and 44.72% for 9/6 Double Double Bonus. A higher hit rate does not automatically mean a higher return.
Are Deuces Wild hand frequencies different from Jacks or Better?
Yes. Wild deuces make hands such as three of a kind, four of a kind and straights much more frequent than they are in non-wild variants. Full-pay Deuces Wild produces three of a kind on about 28.47% of optimal-play hands and four of a kind on about 6.49%.
Is hit frequency the same as RTP?
No. Hit frequency measures how often a payout occurs, while RTP measures the theoretical proportion of wagered money returned across all payouts over the long run. A game can have a relatively high hit frequency but a lower RTP if many of those hits return only small amounts.
Can hand frequencies predict when the next winning hand will occur?
No. Hand-frequency statistics describe long-run probabilities and cannot identify which specific hand will win next. A rare combination does not become guaranteed simply because it has not appeared recently.
Short Conclusion
Video poker hand frequencies depend on three connected factors: the game variant, the paytable and the strategy used. In 9/6 Jacks or Better, a paying hand occurs about 45.46% of the time under optimal strategy, but individual results range from a high pair at roughly 21.46% to a royal flush at only about 0.0025%.
When comparing video poker games, use hand frequency to understand how the game distributes results, but do not use it alone to judge value. Paytable, optimal RTP, volatility and strategy requirements matter just as much, and none of these statistics can predict the outcome of an individual session.