
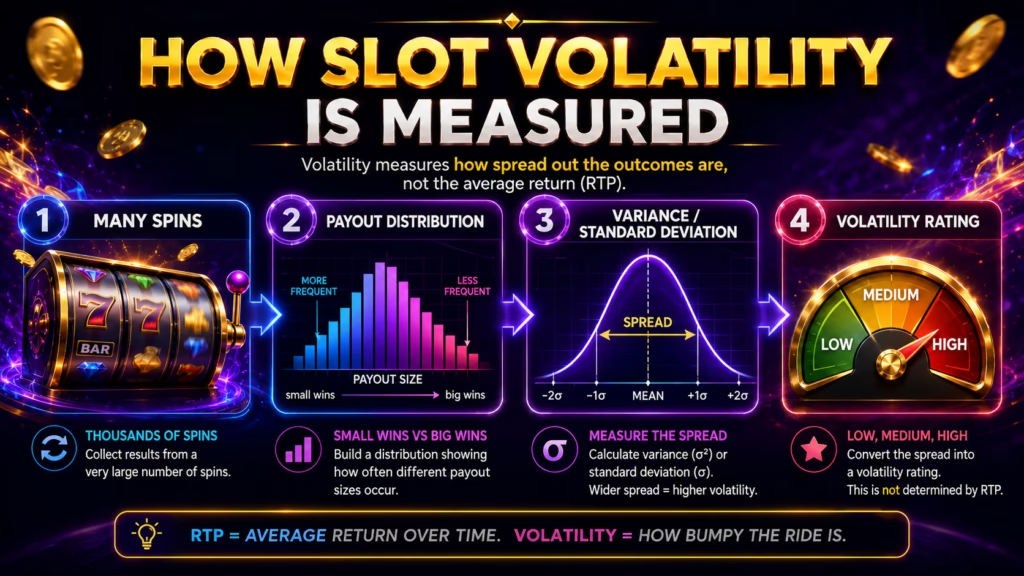
Slot volatility is calculated by measuring how widely a slot’s possible payouts are distributed around its expected return. In mathematical terms, this is usually evaluated through variance and standard deviation, using the probability and payout of each possible outcome. A game with payouts clustered close to the average has lower volatility, while a game that combines many zero or small returns with rare large payouts has higher volatility. One regulatory example, Pennsylvania’s slot-machine technical standard, explicitly calculates standard deviation from outcome probabilities and payouts, then uses it to derive a volatility index.
The key points are:
- RTP and volatility measure different things. RTP measures expected long-term return, while volatility measures how widely results can fluctuate around that expectation.
- Variance and standard deviation are central to slot volatility calculation.
- Two slots can have exactly the same RTP but completely different volatility.
- Hit frequency, maximum win and bonus frequency can influence the experience, but none of them alone calculates volatility.
- Low, medium and high volatility labels should be treated as relative descriptions unless the provider explains its exact classification method.
For players, volatility is useful because it describes the type of swings a slot’s mathematical model can produce. It does not predict whether the next spin, bonus round or session will win.
What Does Slot Volatility Actually Measure?
Slot volatility measures the dispersion of possible payouts around the game’s expected payout. The wider that payout distribution is, the more volatile the game is.
Imagine two theoretical slots with the same 96% RTP. One might return small amounts on a large percentage of spins. Another might produce many losing spins but occasionally award a much larger multiplier. Both games can have the same mathematical return while creating very different short-term results.
This distinction matters because RTP only describes the average expected return over a very large number of wagers. Gaming Laboratories International defines RTP as the expected percentage of wagers returned to players in the long run and notes that mathematical evaluation or simulation may be used depending on the game.
Volatility answers a different question: how far can results move away from that average while the game is being played?
The Basic Slot Volatility Calculation
A simplified volatility calculation starts with every possible payout and the probability of that payout occurring.
Suppose:
- pᵢ = probability of outcome i
- xᵢ = payout for outcome i, expressed as a multiple of the stake
- μ = expected payout, or RTP expressed as a decimal
The expected payout is:
μ = Σ pᵢxᵢ
If a slot has 96% theoretical RTP, the expected payout per one unit wagered is:
μ = 0.96
The variance can then be calculated as:
σ² = Σ pᵢ(xᵢ − μ)²
An equivalent formula is:
σ² = Σ pᵢxᵢ² − μ²
Standard deviation is:
σ = √σ²
A larger standard deviation means payouts are more widely dispersed around the expected value, which indicates greater volatility.
Pennsylvania’s technical standard uses essentially this approach. It calculates an aggregate value from the probability of each winning combination multiplied by the square of its payout, subtracts the square of the payout percentage, and takes the square root to obtain standard deviation. Its regulatory volatility index then multiplies standard deviation by 1.96 for a 95% confidence calculation.
Slot Volatility Calculation Example
A simplified example shows why RTP alone cannot describe how a slot behaves.
Consider two imaginary games. These are mathematical examples, not real slots.
| Metric | Game A | Game B |
| RTP | 96% | 96% |
| Approx. hit frequency | 80% | 20% |
| Standard deviation | 0.48 | 6.49 |
| Relative volatility | Low | Much higher |
Game A
Game A has only two possible outcomes:
- 20% probability of a 0x payout
- 80% probability of a 1.2x payout
Its expected payout is:
(0.20 × 0) + (0.80 × 1.2) = 0.96
So the theoretical RTP is 96%.
Because nearly all outcomes are concentrated around 0x and 1.2x, the standard deviation is only about 0.48.
Game B
Game B has this theoretical distribution:
- 80% probability of 0x
- 15% probability of 1x
- 4% probability of 4x
- 1% probability of 65x
Its expected payout is also:
(0.80 × 0) + (0.15 × 1) + (0.04 × 4) + (0.01 × 65) = 0.96
Game B therefore also has a 96% RTP.
However, its payouts are spread much further from the 0.96 expected value. Its standard deviation is approximately 6.49, far higher than Game A.
This example demonstrates the central principle of slot volatility: identical RTP does not mean identical risk or payout distribution.
How Is Volatility Calculated for a Real Slot?
Real slot volatility calculation is considerably more complicated because modern games can contain thousands, millions or vastly more possible game paths.
A mathematical model may need to account for:
- Reel strips or other outcome-generation structures.
- Probability of each symbol configuration.
- Payline, ways-to-win or cluster probabilities.
- Wild substitutions.
- Scatter awards.
- Free-spin triggers.
- Retriggers.
- Multipliers.
- Cascades or tumbling sequences.
- Hold-and-win or respin features.
- Progressive or fixed jackpots.
- Bonus games with several possible stages.
- Feature contributions to overall RTP.
Game mathematics can be evaluated by calculating possible combinations or through simulations when the quantity of combinations becomes very large. Mathematical evaluations can separately examine base-game return, feature-game return, jackpot contribution and volatility.
The final volatility figure therefore reflects the complete payout distribution, not simply what happens during ordinary base-game spins.
Why Variance and Standard Deviation Matter
Variance gives disproportionately greater weight to payouts that are far away from the average because each deviation is squared.
That characteristic is particularly important for slots.
Consider a rare 1,000x payout. Even if its probability is extremely small, the squared payout used in the variance calculation is:
1,000² = 1,000,000
A very rare high-value outcome can therefore contribute substantially to volatility even though it contributes only a limited amount to RTP.
This explains why examining only the average payout can hide major differences between slot math models.
Standard deviation converts variance back into the same basic units as the payout variable, making the size of the dispersion easier to interpret.
RTP vs Volatility
RTP measures expected return. Volatility measures variation around that return.
A 96% RTP theoretically means that the game is designed to return 0.96 units for every 1 unit wagered when considered across the mathematical long run. It does not mean a player should expect to receive $96 after personally wagering $100.
Actual results can differ substantially from theoretical RTP over limited samples. Regulatory guidance on RTP monitoring notes that volatility affects how wide an acceptable statistical range around theoretical RTP can be, with that range becoming narrower as the number of plays increases.
This creates four possible combinations:
- high RTP and low volatility;
- high RTP and high volatility;
- lower RTP and low volatility;
- lower RTP and high volatility.
Knowing one metric does not automatically tell you the other.
Hit Frequency vs Slot Volatility
Hit frequency measures how often a defined winning result occurs, while volatility measures the distribution and magnitude of all payouts.
A high hit frequency can contribute to a smoother experience, but it does not automatically mean a slot has low volatility.
For example, a slot could frequently return tiny wins while reserving a meaningful part of its RTP for a very rare high-paying bonus. The game could therefore have relatively frequent winning events and still retain substantial variance.
The definition of a “hit” also matters. A payout smaller than the original wager may count statistically as a winning combination even though the player’s balance has decreased after the spin.
For this reason, hit frequency should not be used as a substitute for a proper slot volatility calculation.
Does Maximum Win Determine Volatility?
Maximum win alone cannot determine a slot’s volatility.
A 20,000x maximum payout sounds highly volatile, but the mathematical effect depends heavily on its probability and on all other possible outcomes.
Two slots could both advertise a 20,000x maximum win. One might allocate a larger portion of its RTP to medium and high multipliers, while another might concentrate almost all ordinary payouts at low values and make the maximum outcome exceptionally rare.
Their volatility could therefore differ considerably.
To calculate volatility correctly, the probability distribution matters just as much as the payout values themselves.
How Bonus Features Affect Volatility
Bonus features can increase volatility when they concentrate a significant percentage of a slot’s theoretical return into relatively rare events.
Suppose a slot has:
- a modest-paying base game;
- a free-spins round that triggers infrequently;
- expanding multipliers during free spins;
- rare retriggers capable of producing very large payouts.
A meaningful portion of the game’s RTP may then depend on reaching the bonus and obtaining favorable outcomes inside it.
Another game could deliver approximately the same RTP through more frequent base-game payouts and less powerful bonuses. The second mathematical model would generally produce a narrower payout distribution if other factors were comparable.
This is why the contribution of feature games is included in professional game-mathematics analysis rather than evaluating the base game in isolation.
How Volatility Changes Over Many Spins
For a simplified model where game rounds are identically distributed and suitable independence assumptions apply, the standard deviation of cumulative results grows roughly with the square root of the number of rounds:
SDₙ = σ√n
The expected total, however, grows proportionally with the number of wagers.
When looking at average RTP rather than total payout, statistical uncertainty therefore tends to narrow as the sample becomes larger. Regulatory RTP-monitoring examples show the same effect: the tolerance around expected RTP becomes much narrower at very large sample sizes than at smaller ones.
A short personal session is nowhere near enough to force results toward theoretical RTP. High-volatility slots can produce particularly large short-term deviations.
Can You Calculate Slot Volatility Yourself?
You can estimate volatility from a large dataset of actual spin results, but calculating the true theoretical volatility requires the game’s underlying probability model.
For observed results x₁, x₂, …, xₙ, sample variance can be estimated using:
s² = Σ(xᵢ − x̄)² / (n − 1)
and sample standard deviation is:
s = √s²
The problem is sample size. Rare jackpots, bonus rounds and extreme multipliers may have a major effect on theoretical variance while never appearing in a small dataset.
A few hundred or even several thousand personal spins should therefore not be treated as a reliable reverse-engineering method for a complex slot’s true volatility.
Low vs Medium vs High Slot Volatility
Consumer-facing volatility labels are best treated as relative risk descriptions, not universally interchangeable measurements.
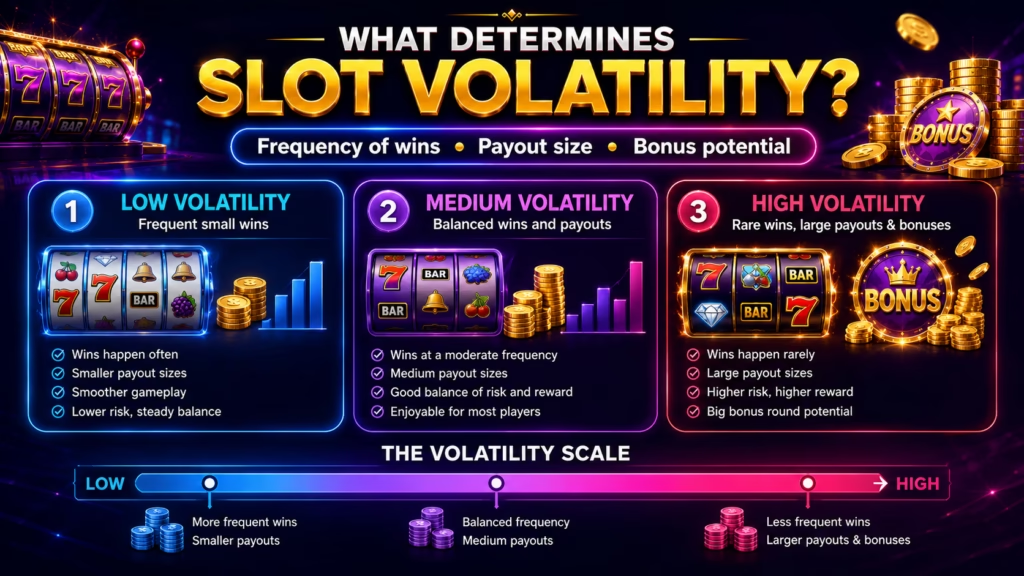
Low-volatility slots generally concentrate more of their return in smaller or less extreme payouts. They may appeal to players who prefer smaller balance fluctuations.
Medium-volatility slots generally sit between the two extremes, although the exact classification depends on the game’s mathematical model and the provider’s terminology.
High-volatility slots generally allocate more probability weight to outcomes farther away from the average, potentially producing longer periods with limited returns alongside occasional much larger payouts.
A technical volatility calculation may produce a precise variance or standard deviation, but converting that value into labels such as 1/5, 3/5, “medium-high” or “very high” depends on the classification system being used. Regulatory standards can also define particular volatility calculations for their own purposes.
Common Mistakes When Judging Slot Volatility
One common mistake is assuming that high RTP means low volatility. The two values describe different characteristics of the game.
Another is using maximum win as the only indicator. Maximum payout says nothing about how probability is distributed across all the other outcomes.
A third mistake is equating hit frequency directly with volatility. Hit frequency counts qualifying winning events, whereas volatility depends on both probability and payout size.
Players should also avoid interpreting a long losing sequence as evidence that a high-volatility slot is “due” for a large win. Previous results do not by themselves create a mathematical obligation for the next random outcome to compensate for earlier losses. Some games contain state-dependent features, collections or bonus mechanics, but those operate according to the game’s disclosed rules rather than because losses must be recovered.
How to Use Volatility When Choosing a Slot
Volatility is most useful when combined with other information rather than considered alone.
Before playing, check:
- theoretical RTP;
- stated volatility or variance level;
- paytable;
- maximum payout;
- bonus mechanics;
- jackpot structure;
- hit frequency if disclosed;
- different RTP configurations if applicable;
- minimum and maximum stake.
Regulated game information may include RTP, house edge or information about winning probabilities, depending on the game and jurisdiction. Relevant game rules and payout information should be accessible before gambling.
Players with a limited entertainment budget may prefer lower-volatility games because extreme balance swings are generally less central to their payout structure. Players choosing a high-volatility slot should understand that large potential payouts can be accompanied by substantial short-term variation.
Neither choice improves the probability of making money from slots. Volatility changes the distribution of results, not the basic fact that gambling outcomes are uncertain.
How This Information Was Reviewed
The slot volatility calculation described here is based on probability distribution, variance and standard deviation, including methodology used in regulated slot-machine technical standards. Professional game-mathematics analysis also evaluates complete game models, including base games, features and jackpots, rather than judging volatility from maximum win or hit frequency alone.
For a specific slot, check the provider’s game rules, paytable and information screen because RTP configurations, available features and operator settings can differ. A volatility rating does not guarantee how any individual session will behave, and RTP does not predict the outcome of a particular spin.
Slots should be treated as paid entertainment rather than a method of earning money. Set spending and time limits before playing, and stop if gambling stops being recreational.
FAQ
What formula is used to calculate slot volatility?
Slot volatility is commonly evaluated using the variance and standard deviation of the game’s payout distribution. If pᵢ represents the probability of a payout and xᵢ represents its value, variance can be written as Σpᵢxᵢ² − μ², where μ is the expected payout. Standard deviation is the square root of that variance.
Is slot volatility the same as variance?
The terms are closely related but are not mathematically identical. Variance is the squared dispersion of payouts around their expected value, while standard deviation is the square root of variance. “Volatility” is often used more broadly to describe the overall degree of payout variation.
Can two slots have the same RTP and different volatility?
Yes. Two slots can both have 96% RTP while distributing that return very differently. One could generate frequent small payouts, while another could concentrate more of its theoretical return in rare high-value outcomes. RTP measures the average expected return, not the shape of the payout distribution.
Does high volatility mean a slot pays less often?
High-volatility slots often involve a wider payout distribution, but low hit frequency is not a mathematical requirement for every high-volatility game. A slot could produce frequent small winning combinations and still have substantial volatility if rare large payouts contribute heavily to the overall variance.
Does a large maximum win automatically mean high volatility?
No. Maximum win is only one possible outcome. Its effect on volatility depends on how likely that payout is and how all other payouts are distributed. A proper calculation requires both payout amounts and their probabilities.
Is a high-volatility slot better than a low-volatility slot?
Neither category is inherently better. Lower volatility may suit players who prefer less extreme fluctuations, while higher volatility may appeal to players comfortable with wider swings and rare larger payouts. Neither type guarantees wins or profitable play.
Can I estimate volatility from 1,000 spins?
You can calculate a sample standard deviation from 1,000 recorded results, but it may be a poor estimate of theoretical slot volatility. Rare bonuses and extreme payouts can have a major mathematical influence without appearing at all in a small sample.
Does increasing the bet change slot volatility?
If increasing the bet only multiplies every payout proportionally, currency variance increases with the square of the stake and standard deviation increases proportionally, while normalized volatility remains essentially the same. If a different bet activates different features, paytables or game rules, the underlying mathematical model may change and should be checked separately.
Can volatility predict when a big win will happen?
No. Volatility describes the statistical distribution of possible results, not the timing of the next large payout. A high-volatility rating does not mean that a large win becomes due after a sequence of losing spins.
Brief Conclusion
Slot volatility is fundamentally calculated from payout probabilities, expected return, variance and standard deviation. The larger the dispersion between ordinary results and rare high-value outcomes, the greater the volatility.
RTP, hit frequency, maximum win and bonus frequency can help describe a slot, but none of them alone determines volatility. The most reliable assessment comes from the complete mathematical payout distribution. For players, volatility should be used to understand potential swings and choose an appropriate entertainment budget, not to predict wins.