
Slot volatility measures how widely a slot’s payouts vary around its expected return. A practical way to calculate slot volatility is to model thousands or millions of spins, record the return from every simulated spin, and calculate the variance or standard deviation of those returns. Confidence intervals can then show how much statistical uncertainty remains in the estimate.
Random slot outcomes do not need to produce their theoretical RTP during a short session. Random games rely on the statistical probability of outcomes rather than continuously adjusting results to force a target RTP. This distinction is essential when interpreting both RTP and volatility.
Quick takeaways:
- Slot volatility can be quantified using the variance or standard deviation of returns per spin.
- A slot volatility simulation approximates the payout distribution by generating a large number of random game rounds.
- Rare large payouts can have a major effect on volatility even when two games have almost identical RTP.
- Confidence intervals indicate how precise a simulation-based estimate is.
- Increasing the number of simulated spins normally improves precision, but rare jackpots may require extremely large samples.
- Volatility describes payout dispersion, not whether a particular player is likely to win in a specific session.
Volatility analysis is most useful for developers, game testers, mathematically minded players, and anyone comparing why two slots with similar RTP can produce very different gameplay experiences. Players should not use a volatility figure as a prediction tool because individual spins remain random.
What Is Slot Volatility?
Slot volatility is the degree of variation in the amount returned from one spin to another. A low-volatility game normally concentrates more of its mathematical return in smaller outcomes, while a high-volatility game can allocate more of its return to relatively rare high-value outcomes.
Mathematically, volatility is commonly represented through variance or its square root, standard deviation.
For a slot with possible returns x₁, x₂, …, xₖ and probabilities p₁, p₂, …, pₖ, the expected return per unit wager is:
μ = Σ pᵢxᵢ
The variance is:
σ² = Σ pᵢ(xᵢ − μ)²
The standard deviation is:
σ = √σ²
If payouts are expressed as multiples of the stake, the same formulas can be applied independently of the actual currency wagered.
The theoretical mean and volatility can sometimes be calculated directly when the complete probability distribution is known. Simulation becomes particularly useful when a slot contains complex features such as free spins, persistent modifiers, multipliers, jackpots, cascades, or several interacting random processes.

RTP and Volatility Measure Different Things
RTP measures the mathematical average amount returned relative to the amount wagered over a sufficiently large number of game rounds. Volatility measures how widely individual results are distributed around that average.
A slot could therefore have a theoretical RTP of approximately 96% while producing either relatively concentrated payouts or a distribution containing long sequences of zero returns combined with rare large wins.
RNG-derived games have designed RTP values, and operators may monitor whether games continue to operate as intended after release. RTP monitoring, however, should not be confused with measuring volatility. Two games can converge toward similar average returns while having substantially different variances.
This is why RTP alone cannot explain how a slot feels during normal play.
How to Calculate Slot Volatility From a Paytable
When every possible outcome and its probability are available, theoretical volatility can be calculated without running a simulation.
Consider this deliberately simplified hypothetical slot:
| Return per spin | Probability |
| 0x | 70% |
| 0.5x | 12% |
| 1x | 8% |
| 2x | 6% |
| 5x | 3% |
| 54x | 1% |
The expected return is:
(0 × 0.70) + (0.5 × 0.12) + (1 × 0.08) + (2 × 0.06) + (5 × 0.03) + (54 × 0.01) = 0.95
That corresponds to a theoretical RTP of 95% in this simplified example.
Applying the variance formula produces a variance of approximately:
29.36
and a standard deviation of approximately:
5.42
The important point is not the label assigned to that number. The example shows how one relatively rare 54x outcome contributes strongly to payout dispersion even though the average return remains 0.95 units per unit wagered.
Real slots normally have far more complicated outcome distributions, so the calculations may incorporate reel strips, symbol weights, paylines or ways to win, feature triggers, free-spin states, multipliers, jackpots, and other game logic.
How Slot Volatility Simulation Works
A slot volatility simulation repeatedly executes the mathematical model of the game and records the resulting payout from each round.
A basic simulation process is:
- Define the game’s probability model.
- Generate a random outcome using the same mathematical probabilities as the game.
- Calculate the total return from that game round.
- Record the result.
- Repeat the process for a large number of rounds.
- Calculate sample RTP, variance, standard deviation, hit frequency, and other relevant statistics.
- Compare simulated estimates with the theoretical model.
- Quantify uncertainty using confidence intervals or repeated simulation runs.
The random-number mechanism matters because slot outcomes are generated from random or pseudorandom processes rather than from a system that must compensate immediately after a sequence of wins or losses. Short-term actual returns can therefore differ from the theoretical RTP.
Why Millions of Simulated Spins May Be Needed
The number of spins required for a stable estimate depends heavily on the payout distribution.
A game dominated by frequent small outcomes may converge relatively quickly. A game containing rare 1,000x, 10,000x, or even larger theoretical outcomes may require substantially more observations before those events are represented often enough for the estimated variance to become stable.
This creates an important problem: RTP may appear reasonably stable before volatility does.
Variance squares the distance between each result and the mean. A single exceptionally large payout can therefore have a disproportionate effect on the variance estimate.
For this reason, professional analysis should not simply choose an arbitrary number such as one million spins and assume the result is exact. The analyst should examine whether increasing the simulation size materially changes the estimated statistics.
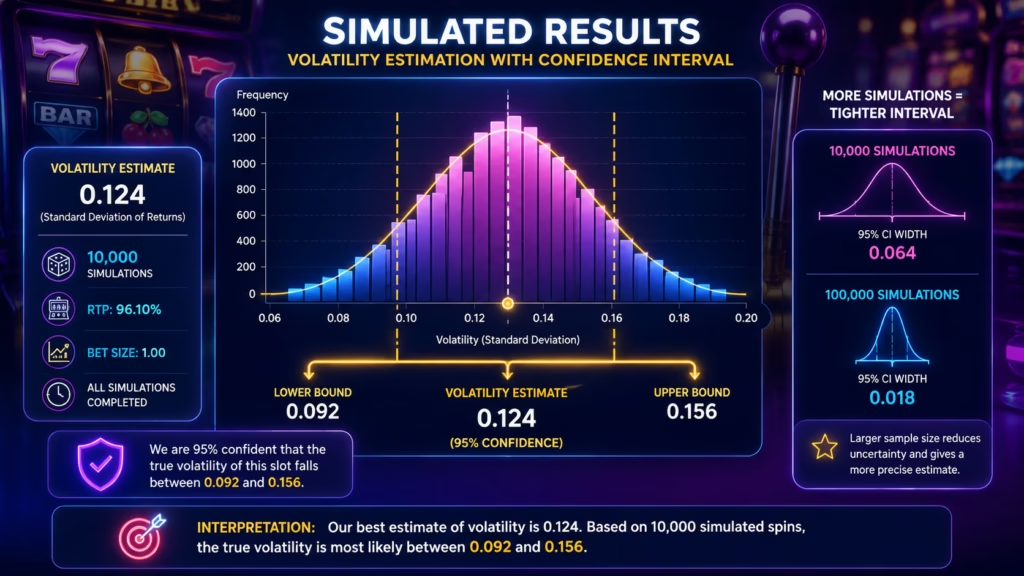
What Is a Confidence Interval in Slot Simulation?
A confidence interval provides a range around an estimated statistic rather than treating a simulation result as an exact value.
For example, suppose a simulation estimates an average return of 0.958 units per unit wagered. Reporting only 95.8% can create false precision. The simulation is one random sample from the underlying game distribution, so another equally large simulation could produce a slightly different result.
For a sample mean, a conventional confidence interval can be written as:
x̄ ± t · s / √N
where:
- x̄ is the observed sample mean;
- s is the sample standard deviation;
- N is the number of observations;
- t is the appropriate critical value for the selected confidence level.
Increasing sample size narrows a confidence interval through the √N relationship, while greater standard deviation produces wider intervals. The same principle explains why high-volatility slots can require much larger simulation samples to estimate RTP with comparable precision.
Confidence Intervals for Volatility Are More Complicated
Estimating a confidence interval for the volatility itself requires more care than estimating the mean return.
A textbook confidence interval for population standard deviation can be constructed using a chi-square distribution when the relevant statistical assumptions are appropriate.
Slot payout distributions, however, can be highly asymmetric and heavy-tailed because most outcomes may be zero or small while a tiny proportion may be extremely large. A simple normal-distribution assumption may therefore be inappropriate for some game models.
Simulation analysts can instead use methods such as:
- repeated independent simulation batches;
- bootstrap resampling;
- empirical distributions of variance estimates;
- direct mathematical calculation when the full probability distribution is available.
The correct method depends on the structure of the game and what statistic is being estimated.
Batch Simulation Helps Reveal Instability
Running one enormous simulation gives a point estimate, but dividing testing into independent batches can reveal whether that estimate is stable.
For example, an analyst could conduct 100 independent simulations of one million rounds each rather than viewing 100 million rounds only as one undivided dataset.
Each batch could produce estimates for:
- RTP;
- standard deviation;
- variance;
- hit frequency;
- bonus frequency;
- average bonus value;
- maximum observed return.
If volatility estimates vary dramatically between batches, the game may contain rare outcomes that have not yet been sampled consistently.
Batch analysis also makes it easier to see whether additional simulation is improving precision.
Simulation Error Does Not Mean the Slot Mathematics Changed
A simulated RTP of 94.9% followed by another simulation returning 96.4% does not automatically indicate that the underlying game has changed.
Sampling variation is expected when random observations are used to estimate a theoretical value. Confidence intervals are designed to quantify this uncertainty rather than eliminate it.
A point estimate and an interval estimate serve different purposes because repeated random samples can produce different sample means.
The practical question is therefore not simply, “Did the simulation exactly reproduce the theoretical RTP?” A stronger question is, “Is the observed difference consistent with the statistical uncertainty expected at this sample size?”
Common Mistakes When Testing Slot Volatility
Calling Hit Frequency Volatility
Hit frequency measures how often a predefined winning outcome occurs. Volatility describes the dispersion and magnitude of returns.
A game can produce frequent small wins while still reserving enough mathematical weight for rare large awards to create substantial variance.
Using RTP as a Volatility Rating
RTP and volatility describe separate properties. A high RTP does not automatically mean low volatility, and a lower RTP does not automatically mean high volatility.
Ignoring Bonus-Round Payouts
If a significant percentage of the game’s return comes from bonus features, excluding those outcomes can severely distort the volatility calculation.
The complete game cycle should be represented according to the actual mathematical model.
Stopping a Simulation When the Answer Looks Right
Simulation length should be determined by statistical precision and coverage of relevant game events, not by whether the current RTP estimate happens to match the expected number.
Treating the Largest Simulated Win as the Maximum Possible Win
A simulation only shows outcomes actually observed during the test. A rare theoretical maximum may never occur even during a very large simulation.
The official game rules or mathematical specification should be checked for the true maximum where that information is required.
What Metrics Should Be Tested Alongside Volatility?
Volatility is more informative when considered with several related statistics:
- RTP: long-run expected return.
- Variance: average squared deviation from the expected return.
- Standard deviation: square root of variance.
- Hit frequency: frequency of qualifying winning outcomes.
- Zero-return frequency: proportion of rounds returning nothing.
- Bonus frequency: estimated frequency of entering a bonus feature.
- Bonus contribution: proportion of theoretical return generated by bonus features.
- Payout percentiles: distribution of observed returns at different thresholds.
- Maximum observed payout: useful for diagnostics but not necessarily equal to the theoretical maximum.
Together, these metrics describe a payout distribution far better than a simple low, medium, or high volatility label.
What Slot Volatility Means for Players
Players do not need to calculate variance before choosing a slot, but understanding the concept helps explain why games with similar RTP can behave very differently.
Higher payout dispersion can mean that a greater share of theoretical return is concentrated in less frequent outcomes. Lower dispersion generally creates a more even distribution of returns.
Neither structure improves the mathematical prediction for the next spin. RNG outcomes remain random, and theoretical RTP and volatility describe long-run game characteristics rather than the result of an individual session.
Players who choose to gamble should set spending and time limits beforehand and treat slot play as entertainment rather than a method of earning money.
How This Information Was Reviewed
The methodology in this article separates three different concepts: theoretical payout mathematics, simulation-based estimates, and statistical uncertainty. Variance and standard deviation are used to explain payout dispersion, while confidence intervals are used to describe uncertainty in estimates generated from finite samples.
General statistical principles for confidence intervals and regulatory concepts related to RNG outcomes, theoretical RTP, testing, and ongoing monitoring were used as reference points when reviewing the methodology.
Exact volatility classifications are not universal numerical standards. A game’s paytable, mathematical specification, rules, and applicable testing requirements should be checked when an exact value is required.
RTP and volatility cannot guarantee or predict a player’s results. Casino games should be treated as entertainment, and players should stop when gambling stops being affordable or enjoyable.
FAQ
How do you calculate slot volatility?
Slot volatility can be calculated from the variance or standard deviation of the payout distribution. Determine the expected return, calculate how far each possible payout lies from that mean, square those differences, weight them by probability, and take the square root of the resulting variance if standard deviation is required.
Can slot volatility be calculated using simulations?
Yes. A slot volatility simulation generates a large number of game rounds and calculates the sample variance or standard deviation of their returns. Larger and properly constructed simulations generally provide more precise estimates, although games with extremely rare large payouts may require very large samples.
Is slot volatility the same as RTP?
No. RTP measures expected long-run return, while volatility measures the dispersion of payouts around that expected return. Two slots can have nearly identical RTP values and substantially different volatility.
How many spins are needed to calculate slot volatility?
There is no universal number that is appropriate for every slot. The required sample size depends on the payout distribution, particularly the probability and size of rare outcomes. Confidence intervals, independent batches, and convergence checks provide more useful evidence than choosing an arbitrary spin count.
Why does a high-volatility slot need more simulation rounds?
High-volatility payout distributions may contain rare outcomes that contribute heavily to overall variance. If those outcomes appear only a few times or not at all in a small simulation, the calculated volatility can be unstable.
What does a 95% confidence interval mean in a slot simulation?
A 95% confidence interval is a statistical procedure designed so that, under its assumptions and across repeated samples, approximately 95% of intervals constructed in that way contain the true parameter. It does not mean there is a 95% chance that a particular player’s future result will fall inside the interval.
Can confidence intervals prove that a slot has the advertised RTP?
Confidence intervals can help determine whether simulated or observed data are statistically consistent with a theoretical RTP, but they are only one part of game testing. The underlying game mathematics, RNG implementation, software, testing methodology, and applicable regulatory requirements may also need verification.
Does high volatility mean a slot pays less often?
Not necessarily. Volatility concerns the overall dispersion of payout values, while hit frequency concerns how often qualifying wins occur. The two metrics are related to the payout structure but are not interchangeable.
Can players use volatility to predict when a big win will happen?
No. Volatility describes the statistical distribution of possible returns and does not identify when a particular outcome will occur. Previous losses or wins do not provide a reliable prediction of the next independent random result.
Brief Conclusion
The most useful answer to how to calculate slot volatility is to measure the variance or standard deviation of the complete payout distribution. When exact probabilities are available, volatility can be calculated mathematically. When game mechanics are too complex for a simple enumeration, a slot volatility simulation can estimate the same statistics across a large number of random rounds.
Confidence intervals add an essential second layer by showing how uncertain those simulation estimates remain. More simulated rounds usually improve precision, but games containing rare, very large payouts can require much larger samples before volatility estimates stabilize.
RTP describes the average destination of the mathematical model. Volatility describes how widely individual outcomes can spread around that average. Neither predicts what will happen during a particular player’s session.